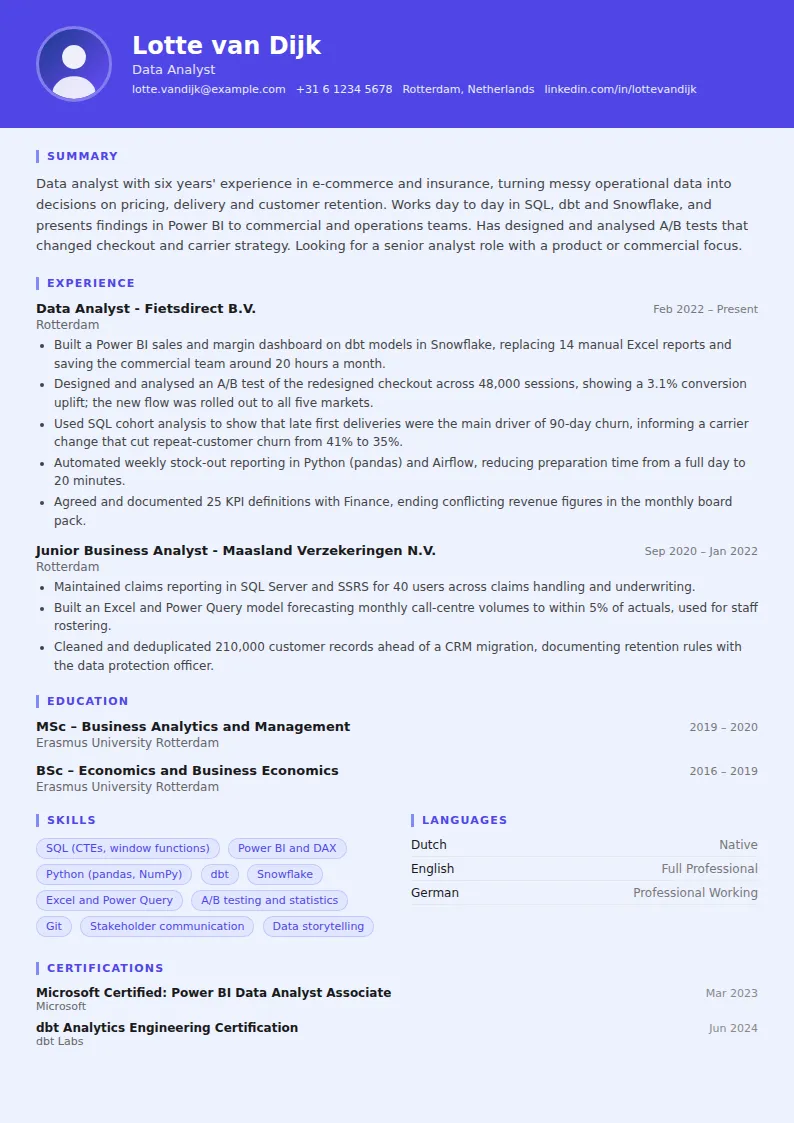
How to write a data analyst CV summary
In three or four sentences, tell the reader which domain you analyse, which tools you work in and what kind of decisions your work feeds. 'Data analyst' alone could mean anything from Excel reporting to product experimentation, so be specific.
- Domain: e-commerce, banking, marketing, healthcare operations, supply chain. Analysts who already know the business questions ramp up faster, and managers know it.
- Stack: your SQL dialect or warehouse, your BI tool and your scripting language.
- Audience: who uses your work, for example commercial directors, product managers or operations leads.
- One result: a test, model or dashboard that changed a decision.
Skip 'data-driven' and 'detail-oriented'. Every analyst claims both; your bullets have to prove them.
Show the decision, not just the dashboard
The most common weakness in analyst CVs is listing outputs: reports built, dashboards maintained, queries written. Hiring managers want to know what happened because of them. A useful structure is question, method, outcome.
- Weak: 'Created churn dashboards in Tableau.'
- Strong: 'Analysed 18 months of order data in SQL to find the drivers of 90-day churn; late first deliveries led to a carrier change that cut churn by 6 percentage points.'
Metrics that work well for analysts: revenue or margin influenced, conversion uplift, churn reduction, forecast accuracy, hours of manual reporting removed, number of active users of a dashboard, and refresh or query times. If your work fed a decision you didn't make, say so honestly ('informed', 'supported') rather than claiming the result as yours.
Technical skills analytics managers check
SQL is the first thing most analyst interviews test, often with a live exercise, so put it at the top of your skills and be specific about depth: joins, CTEs, window functions, query optimisation. After that, reviewers look for:
- A BI tool: Power BI (with DAX), Tableau or Looker. Say which, and whether you build data models or only reports.
- A scripting language: Python (pandas, matplotlib, scikit-learn) or R (tidyverse, ggplot2).
- Modern data stack: dbt, Snowflake, BigQuery, Databricks, Airflow, if you have used them.
- Statistics: hypothesis testing, confidence intervals, regression, experiment design.
- Excel: still expected in finance and operations analytics. Mention Power Query or advanced modelling if you use them.
Rate yourself honestly. If you list Python as Advanced, expect a take-home task in it.
Building a data analyst portfolio
A portfolio matters most if you are junior or switching careers, but it helps at any level when your employer's data is confidential. Two or three solid projects beat a dozen course exercises.
- Start from a business-style question, not a dataset: 'Which Dutch regions saw the fastest rent increases, and how does that compare with income growth?'
- Use open data from Eurostat, your national statistics office or a city open-data portal rather than the same Titanic or Iris datasets every applicant uses.
- Publish SQL and notebooks on GitHub with a README covering the question, approach, findings and limitations.
- Share one finished visual, for example on Tableau Public or as a short written case study, so a manager can see your communication without running code.
- Never publish an employer's data, even anonymised, without permission; GDPR applies to personal data in your portfolio too.
Tailoring, length and format
Analyst roles vary widely, so reorder your CV for each type. For product analytics, lead with experimentation, event data and funnel analysis. For BI and reporting, lead with data modelling, dashboard adoption and automation. For marketing analytics, lead with attribution, GA4 and campaign measurement. For finance, lead with forecasting, Excel modelling and reconciliation.
Mirror the tool names in the job ad. If they use Tableau and you know Power BI, list Power BI and mention that the skills transfer in your cover letter rather than claiming both. Keep the CV to one page early in your career and two at most later. Avoid charts, skill bars and icons on the CV itself: they look odd on an analyst's CV and many applicant tracking systems can't read them.
Data Analyst CV summary examples
Experienced
Senior data analyst with nine years in retail banking and fintech, currently leading a team of four analysts. Built the credit-risk reporting layer in dbt and BigQuery used by 60 colleagues, and introduced an experimentation framework that now runs around 30 tests a year. Comfortable presenting to directors and translating regulatory reporting requirements into reliable data models.
Mid-level
Marketing data analyst with four years' experience measuring paid and CRM campaigns for a travel brand across six European markets. Works in SQL, GA4, Looker Studio and Python to attribute spend and forecast bookings. Rebuilt channel reporting so budget decisions use one agreed source of truth, contributing to a 12% drop in cost per booking.
Entry-level
MSc Statistics and Data Science graduate from KU Leuven with a six-month analytics internship at a logistics company. Wrote SQL and Python to analyse 2 million shipment records and built a Power BI on-time delivery dashboard now used by regional managers. Solid grounding in regression and hypothesis testing; looking for a junior data analyst role.
Data Analyst CV bullet point examples
- Analysed a pricing test across 22,000 orders and recommended a €2 delivery threshold change that raised average basket value by 8%.
- Built a demand forecast in Python that reduced stock-outs on the top 200 SKUs by 18% over two quarters.
- Rewrote slow reporting queries with window functions and incremental dbt models, cutting dashboard refresh time from 45 to 6 minutes.
- Segmented 300,000 CRM customers with k-means clustering, informing a win-back campaign that recovered €140,000 in revenue.
- Automated the weekly trading pack with Python and Airflow, reducing production time from a full day to 20 minutes.
- Replaced 14 spreadsheet reports with a single Power BI model, now used by 85 colleagues each week.
- Defined and documented 25 core KPIs with Finance, ending conflicting revenue figures in board reporting.
- Identified a tracking gap in GA4 that was under-counting mobile conversions, correcting channel ROI figures used for a €1.2 million budget.
- Ran fortnightly SQL clinics for 12 marketing colleagues, cutting ad-hoc data requests to the analytics team by around a third.
- Investigated a 15% rise in claim handling time and traced it to one form change, which was reversed within a month.
Skills for your Data Analyst CV
Hard skills
- SQL (joins, CTEs, window functions)
- Power BI and DAX
- Tableau or Looker
- Python (pandas, NumPy, matplotlib)
- R (tidyverse, ggplot2)
- Excel (Power Query, pivot tables, modelling)
- dbt and data modelling
- Cloud data warehouses (Snowflake, BigQuery)
- A/B testing and experiment design
- Regression and forecasting
- Google Analytics 4
- Git and version control
Soft skills
- Turning vague requests into clear questions
- Data storytelling and visual communication
- Stakeholder management
- Explaining uncertainty to non-technical audiences
- Prioritising ad-hoc requests
- Attention to data quality
- Curiosity about root causes